Paper and citation counts credit every name on the author list. They do not measure work done.
Adding names inflates both totals without new research.
Brian Ripley, among R core’s most active committers for two decades, published far fewer papers than his influence would suggest; none of that commit history is a paper.
1 Author-list pooling
Setup: \(n\) researchers, each with one solo paper and \(c_i\) citations. They put all \(n\) names on every paper. The papers are unchanged; only the lists change.
Outcomes:
Each researcher’s paper count: \(1 \to n\).
Each researcher’s citation count: \(c_i \to S = \sum_j c_j\).
Multiplier:
\[\frac{S}{c_i} = n \cdot \frac{\bar{c}}{c_i}.\]
Papers multiply by exactly \(n\).
Citations multiply by more than \(n\) when citation counts have a heavy right tail: \(\bar{c}/c_i > 1\) for most members.
2 Simulated citation counts
The counts below are synthetic. The question is counterfactual — what the same researchers’ totals would be with and without pooling — and no real database holds both branches.
Generating process:
Draw \(c_i\) from a lognormal distribution (\(\mu = 1.5\), \(\sigma = 1.2\) on the log scale).
Median near 4.5 citations; a few papers in the hundreds.
Stands in for one field’s citation distribution.
Downstream use: hiring panels reading CV totals.
Code
import numpy as npRNG = np.random.default_rng(0)MU, SIGMA =1.5, 1.2# lognormal, on the log scaleGROUPS = (5, 10, 20)REPS =20_000# many draws, so the medians are not a fluke of oneprint(f"{'n':>3}{'papers':>7}{'median':>9}{'share above':>12}{'large-n':>8}")print(f"{'':>3}{'':>7}{'citations':>9}{'n times':>12}{'limit':>8}")for n in GROUPS: c = RNG.lognormal(MU, SIGMA, size=(REPS, n))# Everyone is credited with the group total, so the multiplier is S / c_i. mult = c.sum(axis=1, keepdims=True) / c limit = n * np.exp(SIGMA**2/2) # what median(S / c_i) tends to as n growsprint(f"{n:>3}{n:>6}x {np.median(mult):>8.1f}x {np.mean(mult > n):>11.0%}"f" {limit:>7.1f}x")
  n   papers     median   share above   large-n
              citations       n times     limit
  5       5x       7.3x          63%     10.3x
 10      10x      17.2x          67%     20.5x
 20      20x      37.3x          70%     41.1x
Results (20,000 replicates per \(n\)):
Median citation multiplier exceeds \(n\) at every group size: 7.3× at \(n = 5\), 37× at \(n = 20\).
Most researchers gain more than the \(n×\) paper-count inflation (“share above \(n\) times” column).
3 Unequal redistribution
Pooling rule: every member is credited the group total \(S\), regardless of solo count \(c_i\).
Low-\(c_i\) members gain most.
High-\(c_i\) members gain least; \(S \le n\,c_{\max}\), so the most-cited member cannot reach \(n×\) their solo count.
No one’s credited count falls; relative standing of the top contributor erodes.
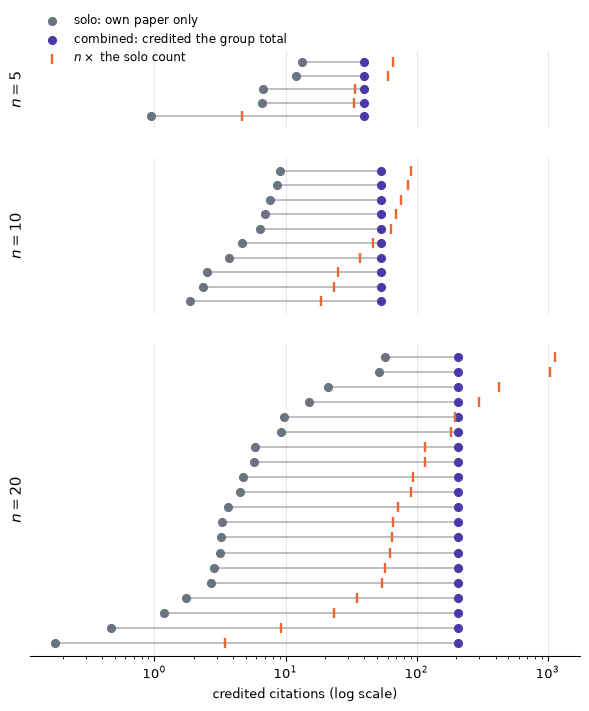
The figure below: one draw per group size. Left end = solo citations; right end = pooled total; orange tick = \(n ×\) solo count.
Code
import matplotlib.pyplot as pltSOLO, COMBINED, REF ="#6b7280", "#4a3aa7", "#eb6834"rng = np.random.default_rng(1)fig, axes = plt.subplots(3, 1, figsize=(7.4, 8.2), sharex=True, gridspec_kw={"height_ratios": GROUPS, "hspace": 0.16})for ax, n inzip(axes, GROUPS): c = np.sort(rng.lognormal(MU, SIGMA, size=n)) total, y = c.sum(), np.arange(n) ax.hlines(y, c, total, color=SOLO, lw=1.2, alpha=0.55, zorder=1) ax.scatter(c, y, s=34, color=SOLO, zorder=3, label="solo: own paper only") ax.scatter(np.full(n, total), y, s=34, color=COMBINED, zorder=3, label="combined: credited the group total") ax.scatter(n * c, y, s=52, marker="|", color=REF, lw=1.8, zorder=4, label=r"$n \times$ the solo count") ax.set_xscale("log") ax.set_ylim(-0.9, n -0.1) ax.set_yticks([]) ax.set_ylabel(f"$n = {n}$", fontsize=11) ax.grid(axis="x", color="0.9", lw=0.7) ax.set_axisbelow(True)for side in ("top", "right", "left"): ax.spines[side].set_visible(False)for ax in axes[:-1]: ax.spines["bottom"].set_visible(False) ax.tick_params(axis="x", which="both", bottom=False)axes[0].legend(frameon=False, fontsize=9, loc="upper left", bbox_to_anchor=(0.0, 1.6))axes[-1].set_xlabel("credited citations (log scale)", fontsize=10)plt.show()
Figure 1: One draw per group size. Left ends are what each researcher earned alone; right ends are what all of them are credited with after combining. The orange tick marks n times the solo count: left of the total, that researcher beat n times; right of it, they did worse.
Across 20,000 draws: roughly two thirds of researchers clear \(n×\). The most-cited member never does.
4 Real-world instances
Same arithmetic — pool credit, credit everyone named — at three scales:
Scale
Currency exchanged
Example
Authors
Seniority / reciprocity
Honorary authorship: 26% self-reported in health sciences (meta-analysis, 2024); 18% after ICMJE criteria shown; 51% when contributions were checked
Journals
Reciprocal citations
46 journal pairs (55 journals) suspended by Journal Citation Reports by 2019; CIDRE detects citation rings
Institutions
Cash
60+ highly cited researchers added King Abdulaziz University as paid second affiliation (Science, 2011); university ranked second worldwide on highly cited list by 2014
5 Constraints
Teams produce more-cited work than solo authors (Wuchty, Jones and Uzzi, 19.9 million papers). Honest and dishonest incentives both favour adding names.
Most author lists reflect real collaboration; the cases above are not the model at full strength.
Paper and citation counts cannot distinguish earned from gifted authorship.