Once clustering is complete, understanding which features differentiate each cluster is crucial for interpretation. This blog post explores multiple ways to attribute feature importance to clusters and presents a worked example using k-means clustering and decision tree-based feature importance.
Methods for Identifying Important Features
Several approaches can be used to determine which features define each cluster:
Feature Distributions per Cluster
Compute mean, median, or standard deviation per cluster.
Compare distributions using boxplots or violin plots.
Feature Importance via Decision Trees
Train a decision tree classifier on cluster labels.
Extract feature importances from the trained model.
Permutation Importance
Shuffle each feature and measure its impact on cluster assignments using a trained classifier.
SHAP (SHapley Additive exPlanations)
Train a model to predict cluster labels and use SHAP values for feature importance.
PCA or t-SNE Contributions
If PCA or t-SNE was used, examine which features contribute most to the components.
Worked Example: Finding Discriminative Features After Clustering
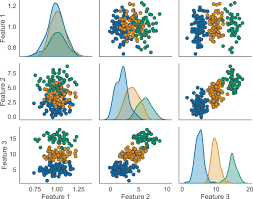
We will apply k-means clustering to the famous Iris dataset and use a decision tree to find the most discriminative features for each cluster.
Code
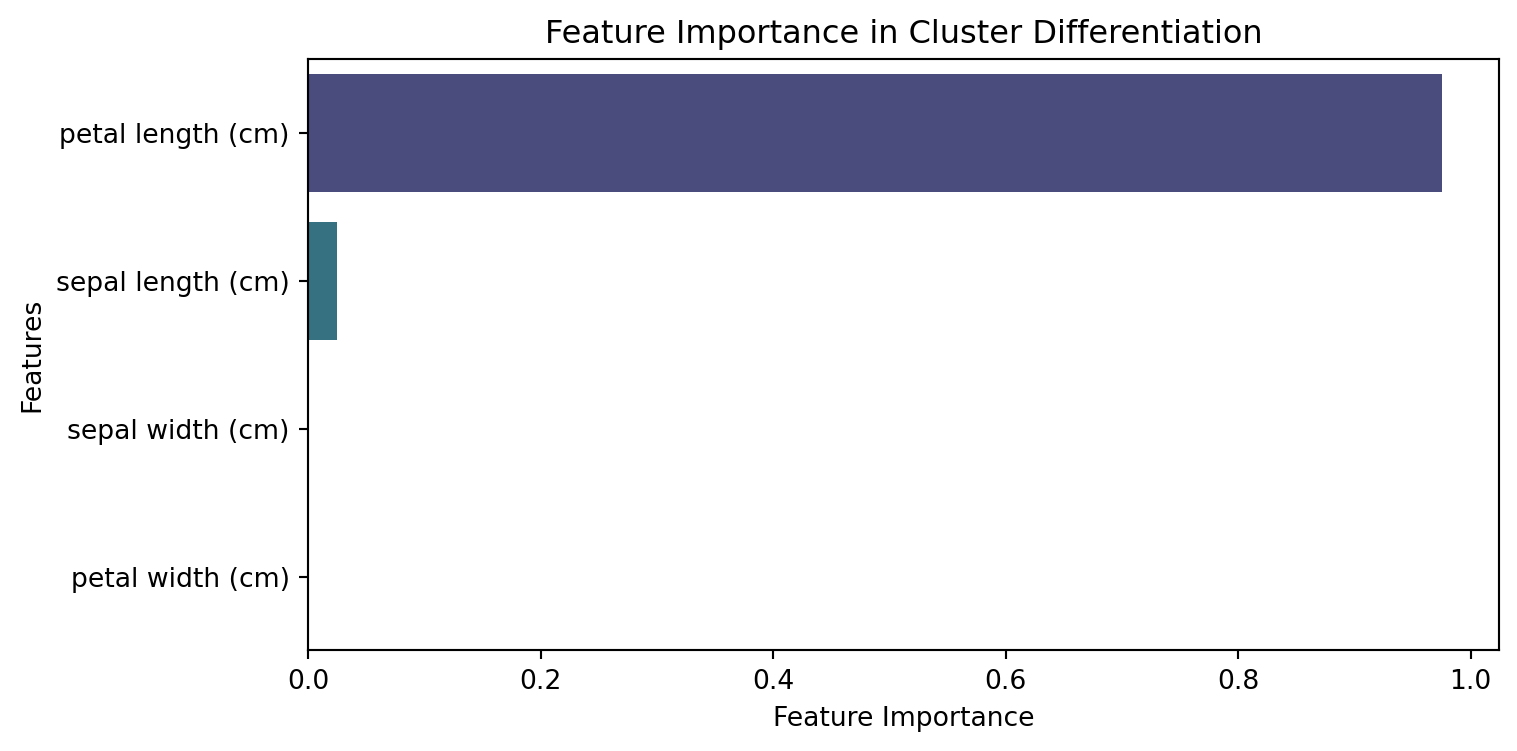
import numpy as npimport pandas as pdimport matplotlib.pyplot as pltfrom sklearn.cluster import KMeansfrom sklearn.datasets import load_irisfrom sklearn.tree import DecisionTreeClassifierfrom sklearn.metrics import accuracy_scoreimport seaborn as sns# Load datasetiris = load_iris()X = pd.DataFrame(iris.data, columns=iris.feature_names)# Perform k-means clusteringkmeans = KMeans(n_clusters=3, random_state=42, n_init=10)X['cluster'] = kmeans.fit_predict(X)# Train a Decision Tree classifier to predict clustersclf = DecisionTreeClassifier(random_state=42)clf.fit(X.drop(columns=['cluster']), X['cluster'])# Extract feature importancefeature_importance = pd.Series(clf.feature_importances_, index=X.columns[:-1]).sort_values(ascending=False)# Plot feature importanceplt.figure(figsize=(8, 4))sns.barplot(x=feature_importance.values, y=feature_importance.index, palette='viridis')plt.xlabel("Feature Importance")plt.ylabel("Features")plt.title("Feature Importance in Cluster Differentiation")plt.show()
/var/folders/p9/vwq0gfs15vb07tg6xw1r14180000gn/T/ipykernel_31587/4064724445.py:27: FutureWarning:


Passing `palette` without assigning `hue` is deprecated and will be removed in v0.14.0. Assign the `y` variable to `hue` and set `legend=False` for the same effect.
Interpretation of Results
The decision tree classifier identifies features that best distinguish the clusters.
The highest-ranked feature is the most important for clustering.
This method can be extended to real-world datasets to interpret clusters in customer segmentation, gene expression analysis, and other domains.
Conclusion
By combining clustering with feature importance techniques, we gain insights into the underlying structure of the data. This process helps in explaining why certain groups form and allows for better decision-making in applications such as marketing, biology, and finance.