Colombian municipal water safety
A Colombian water atlas · 2010–2023
One country.
Many realities.
Every drop matters.
A closer look at drinking-water safety, the urban–rural divide, and the places where the evidence is still missing.
Descriptive evidence. Local context. Open data.
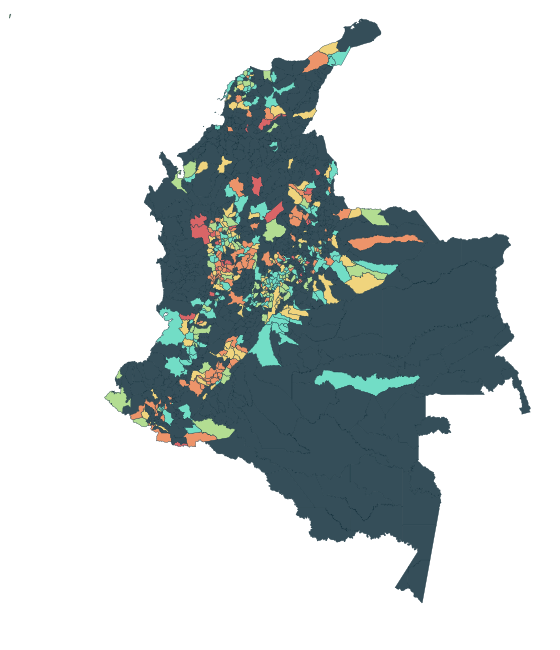
2010–2023 in the source table
Municipalities, an island & non-municipalised areas
Urban and rural zones, side by side
Profile analysis focuses on 2016–2023.
01 / Read between the rows
The gaps are
part of the story.
A map can only show what was reported. Rural water-quality observations are missing much more often than urban ones.
See the data coverageReporting coverage · all source years
How much can we see?
Share of municipality × zone × year rows with a reported value for IRCA (utility-supplied, INS open data), 2010–2023.
Source: data/README.md, computed from the local CSV. The rural decline in the risk score in 2020 may reflect which systems were sampled.
02 / Choose your lens
Follow the questions.
From the national picture
to the detail of a single place.
See the patterns.
Bring water safety and municipal context into view with the interactive dashboard.
Open dashboard → 02 ↗Meet the profiles.
Compare places grouped by water, sanitation and context. Outcomes describe the groups afterwards.
Explore clusters → 03 ↗Get closer
to Tunja.
Take a local view through the Boyacá and Tunja visual exploration.
Visit the local view →03 / Go deeper