Part V: One Analysis, Many Publications
Quarto, reproducible publishing, coding agents, Markdown, Python, EPUB, data analysis, k-means clustering
Where Colombia’s tap water is tested, the countryside’s is far riskier than the towns’. In 2023, of the rural zones (a municipality’s countryside, outside its head town) with a utility-supplied water-risk score, 28% fell in the high-risk or unfit bands, against 6% of urban ones. And much rural water has no score at all: that year, 6.8 million of the 12.6 million people in rural zones lived where the open data hold none.
This part asks which kinds of municipal zone exist, judged by water safety, services and context, and how infant mortality, exam scores and school dropout differ between those kinds. Each row of its data is a zone-year: one municipality’s urban zone (the head town) or rural zone in one year. The analysis groups those rows, so a municipality’s two zones can be different kinds. You are the analyst. Your readers are officials, who need a report, and a municipal council, which needs slides, and both deserve an answer that says plainly what the data cannot show:
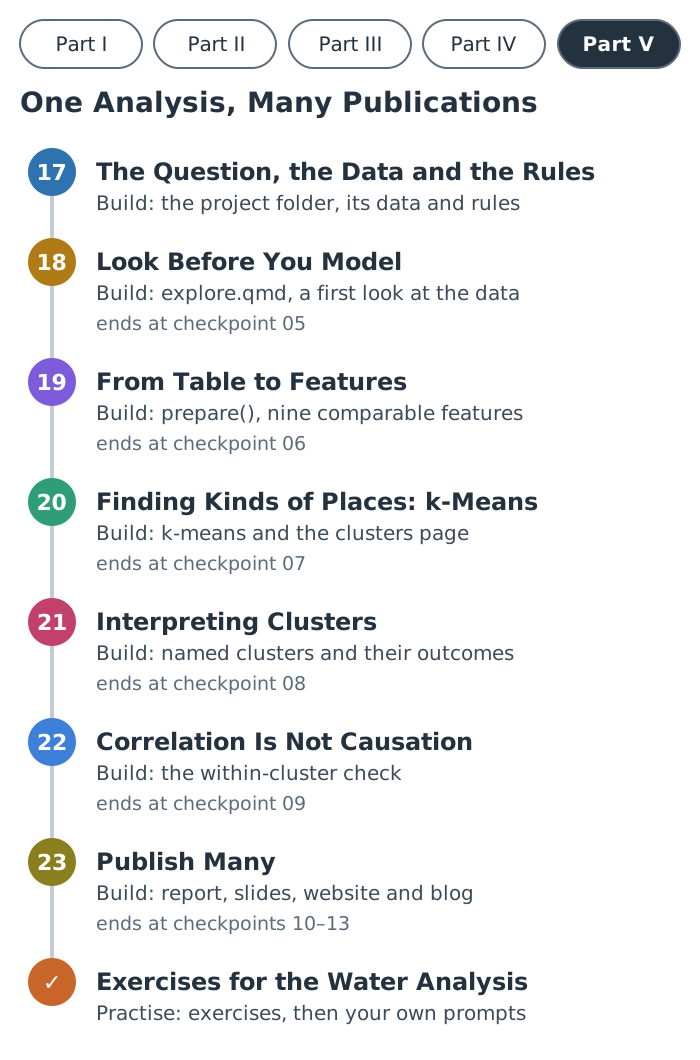
- 17 The Question, the Data and the Rules pins down what is asked, what the data mean and what the agent may not do.
- 18 Look Before You Model finds where the data are empty or misleading, and meets Tunja, the municipality this part follows.
- 19 From Table to Features turns the table into features a clustering can use, and counts the cost.
- 20 Finding Kinds of Places: k-Means lets an algorithm group the zone-years, and decides how many groups there are.
- 21 Interpreting Clusters names the kinds and compares their outcomes.
- 22 Correlation Is Not Causation asks whether worse water goes with more infant deaths, and why that is not a cause.
- 23 Publish Many turns one set of results into a report, slides, a blog post and a website.
The exercises at the end of the part test whether you can do it without the prompts.